
Medical Appointments No-Show Data Analysis And Visualization From A-Z
ALX-Udacity Nanodegree Scholarship |Advanced Data Analytics| Submission May 31,2022| Project 1 |Maximilien Kpizingui | IoT & Machine Learning Engineer


Welcome back to this blog post on medical appointment No- show project which consists of 100k medical appointments in Brazil as part of the Advanced Data Analytics Nanodegree Scholarship by Udacity which seeks to equip and to train young Africans for digital technologies and skills for remote work and local market opportunities. The dataset collects information from more than 100k medical appointments in Brazil and it is focused on the question of whether or not patients show up for their appointment. Without delay, let us get into the data wrangling.
Table of Contents
INTRODUCTION
1- Research questions
2- DATA WRANGLING
3- Section objectives
4- Loading libraries
5- Loading the dataset
6- Exploring data
7- Descriptive information about the dataset
8- Shape of the dataset
9- Statistical data
10- DATA CLEANING
11- Renaming columns
12- Converting date
13- Filtering row Age with -1
14- Dropping negative Age
15- Checking negative Age
16- Converting PatientId and AppointmentId to object data type
17- Displaying minimun value of age
18- Filtering and displaying row with Age==0
19- Dropping Age==0
20- Checking missing values
21- Checking duplicated values
22- Cleaned dataset
23- Exploratory Data Analysis
24- Pie plot of No-show patients
25- Pie plot of gender,hypertenstion and No-show
26- Pie plot of gender,diabetes and No-show
27- Pie plot of gender,SMS_received and No-show
28- Pie plot of gender and No-show
29- Function to plot the distribution in the research question
30- No-show gender distribution
31- Diabetes No-show gender distribution
32- Hypertension No-show gender distribution
33- SMS_received No-show gender distribution
34- Age No-show gender distribution
Conclusion
Limitations
Introduction
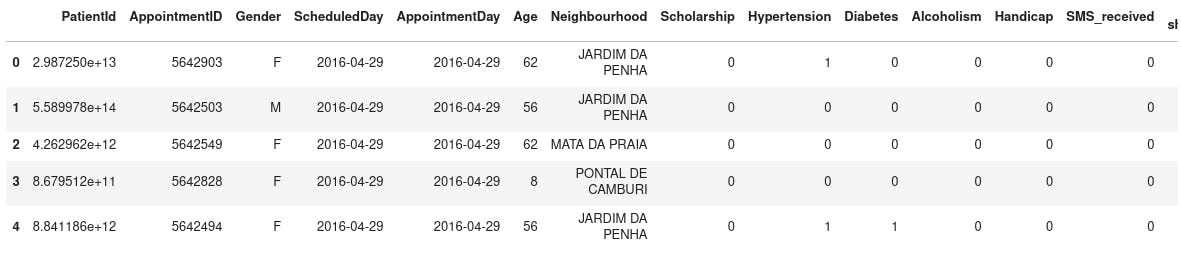
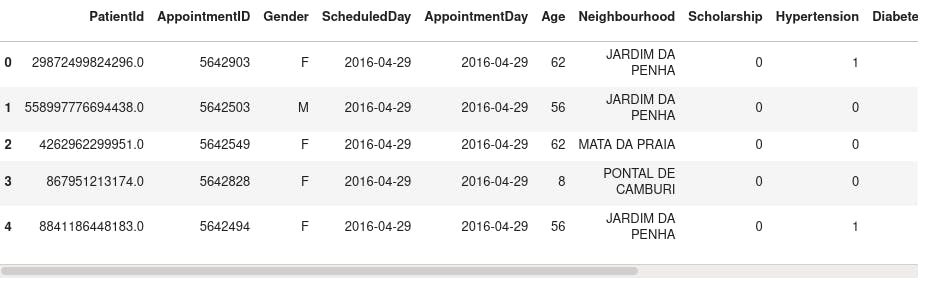
The dataset subject to our analysis contains information recorded from a hospital in Brazil. The dataset has 110,527 data entries starting from 0 to 110526 and 14 columns. The description of each feature variable is shown as below
PatientId: Identification of a patient AppointmentId: Identification of each appointment
Gender: Male or Female
ScheduledDay: The day when the patient scheduled their appointment
AppointmentDay: The day of the appointment
Age: Age of the patient
Neighbourhood: Address of the hospital where the appointment is taken
Scholarship: Boolean 1 if the patient is enrolled into Brazilian welfare program Bolsa Familia 0 otherwise
Hipertension: Patient has hipertension Yes boolean 1; 0 otherwise
Diabetes: Patient has diabetis Yes boolean 1 or 0 otherwise Alcoholism: Patient drink alcohol Yes boolean 1 or 0 otherwise
Handcap: Patient is Handicap Yes boolean 1 or 0 otherwise SMS_received: Patient received a SMS before the appointment Yes boolean 1 or 0 otherwise
No-show: YES boolean 1 if the patient show up during the booking day 0 otherwise
From the description above, the aim of this project is to find out which population of the patient, ill health and disability condition show up or does not to their respective appointment.
1- Research questions
The research question during the brainstorming phase of our analysis are:
1- What is the distribution of the patient that showed up and did not show up during the appointment?
2- What is the distribution of the patients having or not having Hypertension showed up and did not show up during the appointment?
3- What is the distribution of the patients having or not having diabetes showed up and did not show up during the appointment?
4- What is the distribution of the patients who (received or did not a SMS) showed up and did not show up during the appointment?
2- Data Wrangling
3- Section objective
In this section:
We load in the data
We explore the data
We clean the dataset
We preprocess the dataset for visualization and further analysis.
5- Loading the required libraries
import pandas as pd
import numpy as np
import matplotlib.pyplot as plt
%matplotlib inline
5- Loading the dataset
df = pd.read_csv("noshowappointments-kagglev2-may-2016.csv")
6- Exploring data
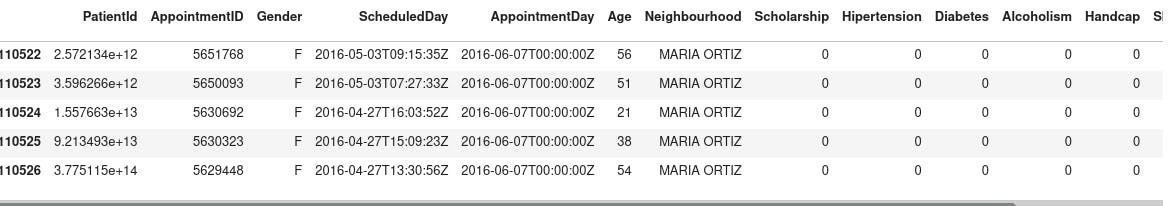
Displaying the last 5 five observations of the dataset
df.tail()
7- Descriptive information about the dataset
df.info()
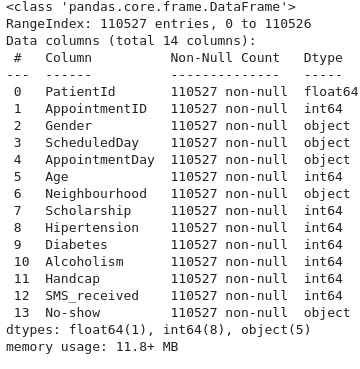
- The dataset has 14 non null features contaning respectively
- 1 data type float: PatientId
- 8 data type integer: AppointmentID,Age,Scholarship,Hipertension,Diabetes,Alcoholism,Handcap,SMS_received
- 5 data type object: Gender,ScheduledDay,AppointmentDay, Neighbourhood,No-show
8- Shape of the dataset
df.shape

- The dataset has 110527 rows which represent the number of observations and 14 columns which represent the number of feature variables
9- Displaying the statistical data of the dataset
df.describe()
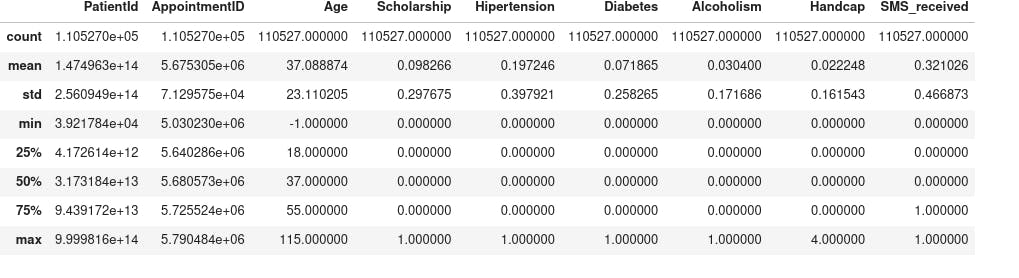
- From the statistical data above we notice a lot of discrepancies in the dataset.
We need to covert it to integer
df.describe().astype('int64')
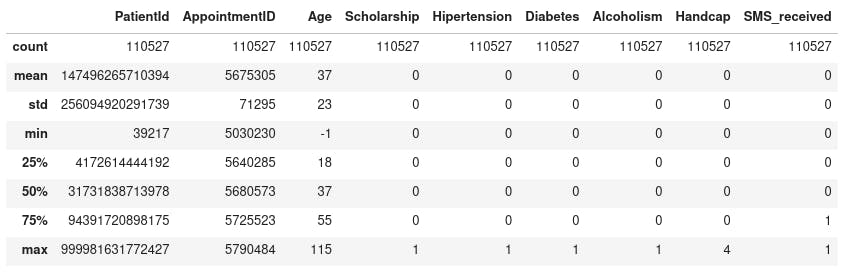
- We notice there is a negative value in the Age colunm
- Besides, PatientID is in float data type we need to convert it in String
- There is columns data mispelling such as hipertension and handcap
- PatientId and AppointmentId are irrelevant to our analysis we need to convert them to String data type
- Exploring the Age of the patient closely
df.Age.describe()
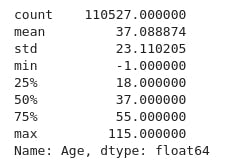 We observe that the mean of the age of the patient is 38 The eldest patient is 115 old
10- DATA CLEANING
From the dataset above, we notice that:
- hipertension and handcap are mispelled
- ScheduledDay and AppointmentDay are not in correct format. We need to convert it in date format
- There is a negative value in the feature variable Age
- there are zeros in the feature variable Age
11- Renaming columns
- Renaming the columns hipertension and handcap
df = df.rename(columns={'Hipertension': 'Hypertension', 'Handcap': 'Handicap'})
12- Converting to date
- From the dataset above, we need to convert ScheduledDay and AppointmentDay from String data type to datetime64 format yyyy-mm-dd.
df['ScheduledDay'] = pd.to_datetime(df['ScheduledDay']).dt.date.astype('datetime64[ns]')
df['AppointmentDay'] = pd.to_datetime(df['AppointmentDay']).dt.date.astype('datetime64[ns]')
df.head()
13- Filtering the row with negative Age
rowAgeNegative= (df.Age==-1)
dfAgeNegative = df[rowAgeNegative]
dfAgeNegative.head()

- We have one row containing -1
14- Dropping negative Age
df = df.drop(dfAgeNegative.index)
15- Filtering if there still exist a negative Age in the dataset row
ages = ['-1']
age_dataset = df[df['Age'].isin(ages)]
age_dataset.head()
 Row as been dropped successfully
16- Converting patiendid and AppointmentId to object data type
df['PatientId'] = df['PatientId'].astype('object')
df['AppointmentID'] = df['AppointmentID'].astype('object')
- Displaying minimun value of the Age
df.Age.min()

- We notice the min value of Age is 0. This is wrong and we may consider it as a data entry error
17- Filtering row with Age=0 and displaying the head of the dataset and the length of the row with age ==0
ages = [0]
age_dataset = df[df['Age'].isin(ages)]
age_dataset.head()
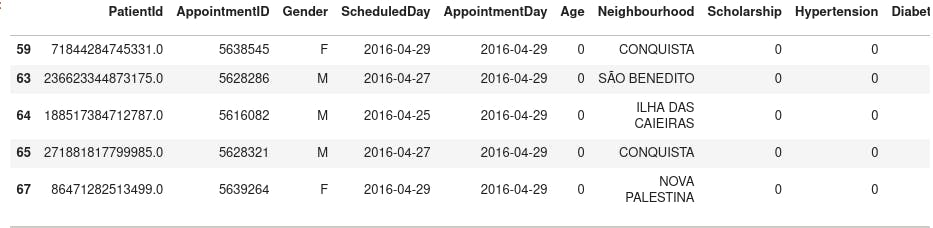
rowAgeZero= (df.Age==0)
dfAgeZero = df[rowAgeZero]
dfAgeZero.head(10)
print("The number of rows containing zero in the Age columns are ",len(dfAgeZero))
- The number of rows containing zero in the Age columns are 3539
18- Dropping row with Age==0
df = df.drop(dfAgeZero.index)
- Checking if any zeros row remained
ages = [0]
age_dataset = df[df['Age'].isin(ages)]
age_dataset.head()

- Data dropped successfully
19- Checking for missing values
df.isnull().sum()
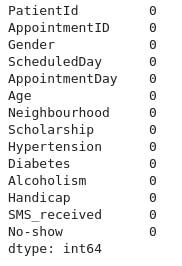
- There is no missing value in the dataset
20 -Checking for duplicated values
sum(df.duplicated())

- There is not duplicated values
21- Displaying preprocessed dataset
df.head()
22- Exploratory Data Analysis
23- Defining a function to plot the pie plot taking three arguments namely the columns, the label and the title of the plot
def myplot(features,label,title ):
    plt.figure(figsize=(8,8))
    plt.pie(df.groupby(features).size(),autopct='%.2f')
    plt.title(title)
    plt.legend(label, loc="lower left")
    plt.show()
24- Pie plot of No-show patients
myplot('No-show',['Not Show','Show'],"No-show distribution" )
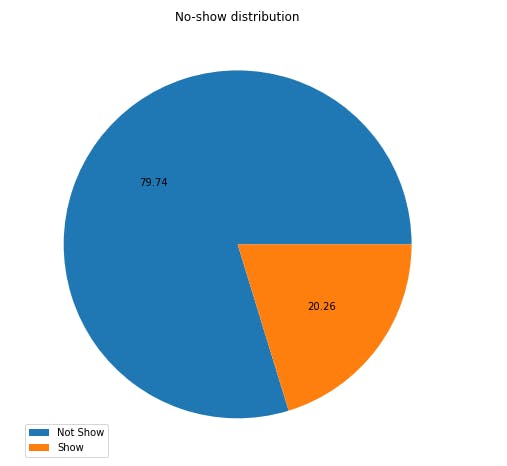
From the above pie plot, we conclude that:
- 79.74% of the patients did not come to the appointment
- Only 20.26 patients come to the appointment
25- Pie plot of gender,hypertenstion and No-show
myplot(["No-show","Gender", "Hypertension"],['Not show,Female,Not hypertension','Not show,Female,hypertension','Not show,Male,Not hypertension','Not show,Male,hypertension', 'Show,Female,Not hypertension', 'Show,Female,hypertension','Show,Male,Not hypertension','Show,Male,hypertension'],"Pie plot of gender, hypertenstion and No-show" )
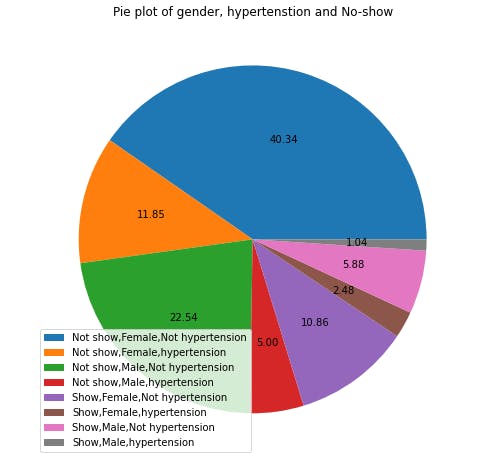
Patient Male
22.54% not having hypertension did not come to the appointment 5.88% not having hypertension came to the appointment 5% of having hypertension did not come to the appointment 1.04% having hypertension came to the appointment
Patient female
40.34% not having hypertension did not come to the appointment 10.86% not having hypertension came to the appointment 2.48% having hypertension came to the appointment 11.85% having hypertension did not come to the appointment
26- Pie plot of gender,diabetes and No-show
myplot(["No-show","Gender", "Diabetes"],['Not show,Female,Not diabete','Not show,Female,diabete','Not show,Male,Not diabete'
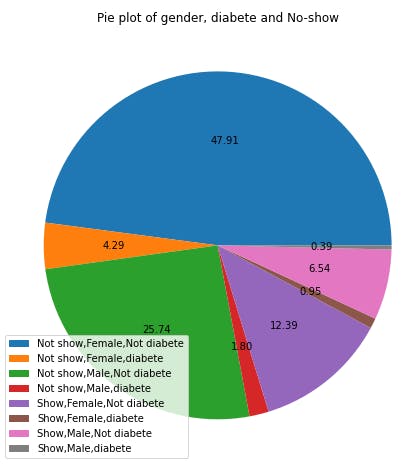
Patient Male
- 25.74% not having diabetes did not come to the appointment
- 6.54% not having diabetes came to the appointment
- 1.8% of having diabetes did not come to the appointment
0.39% having diabetes came to the appointment
Patient female
47.91% not having diabetes did not come to the appointment
- 12.39% not having diabetes came to the appointment
- 0.95% having diabetes came to the appointment
- 4.29% having diabetes did not come to the appointment
27- Pie plot of gender,SMS_received and No-show
myplot(["No-show","Gender", "SMS_received"], ['Not show,Female,Not SMS_received','Not show,Female,SMS_received','Not show,Male,Not SMS_received','Not show,Male,SMS_received', 'Show,Female,Not SMS_received', 'Show,Female,SMS_received','Show,Male,Not SMS_received','Show,Male,SMS_received'],"Pie plot of gender, SMS_received and No-show")
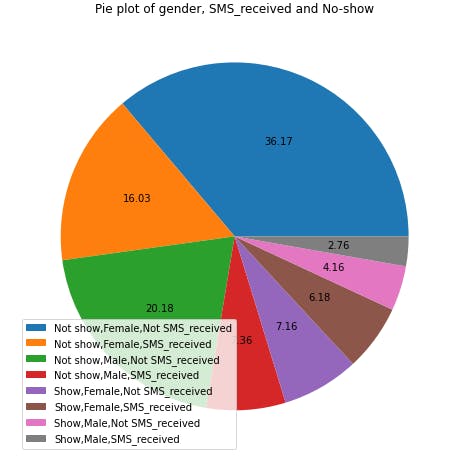
Patient Male
- 20.18% did not received sms did not come to the appointment
- 4.16% did not received sms came to the appointment
- 7.36% received sms did not come to the appointment
- 2.76% received sms came to the appointment
Patient female
- 36.17% not received sms did not come to the appointment
- 7.16% not received sms came to the appointment
- 6.18% received sms came to the appointment
- 16.03% received sms did not come to the appointment
28- Pie plot of gender and No-show
myplot(["No-show","Gender"],['Not show,Female','Not show,Female','Not show,Male','Not show,Male', 'Show,Female', 'Show,Female','Show,Male','Show,Male'],"Pie plot of gender and No-show")
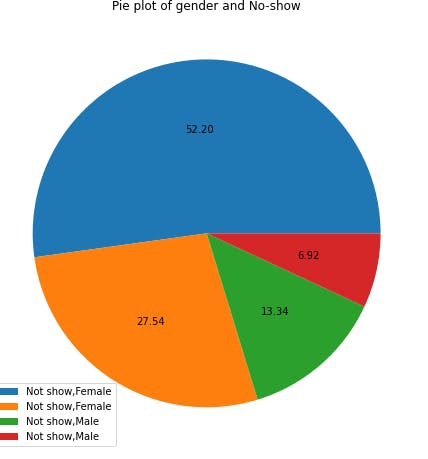
Patient Male
- Out of 34.46% of male, only 6.92% came to the appointment
Patient female
- Out of 65.54 of female, only 13.34% came to the appointment
29- Function to plot the distribution in the research question
def distributionPlot(feature,titleplot):
    gender_column = 'Gender'
    df.groupby(['No-show',feature, gender_column]).size().unstack(level=1).plot(kind='bar',title=titleplot,ylabel='count')
    print(pd.DataFrame(df.groupby(['No-show',feature]).count().PatientId))
30- No-show gender distribution
distributionPlot('Gender','No-show gender distribution')
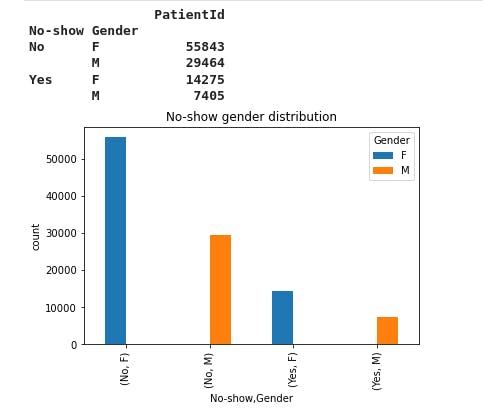
From the bar plot above we notice:
- 14275 female patients showed up to the appointment
- 7405 male patients showed up to the appointment
- 55843 female patients did not show up to the appointment
- 29464 male patients did not show up to the appointment
31- Diabetes No-show gender distribution
distributionPlot('Diabetes','Diabetes No-show gender distribution')
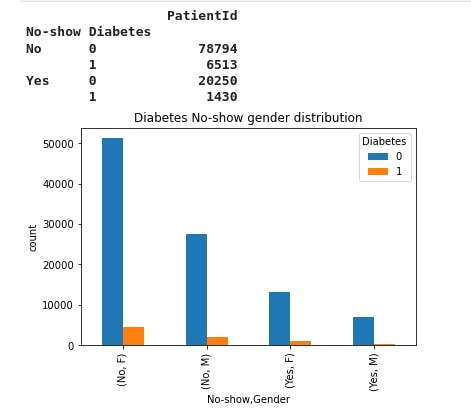
We notice that 1200 female patients with diabete show up to the appointment and 230 male patients with diabete show up to the appointment. Besides 15k female patients without diabete show up to the appointment and 6k patient male without diabete showed to the appointment. Moreover, 52k female not having diabete did not come to the appointment and 4k female having diabete did not come to the appointment. Finally, 28k of male patient not having diabete did not come to the appointment and 2k male patient having diabete did not come to the appointment.
32- Hypertension No-show gender distribution
distributionPlot('Hypertension',' Hypertension No-show gender distribution')
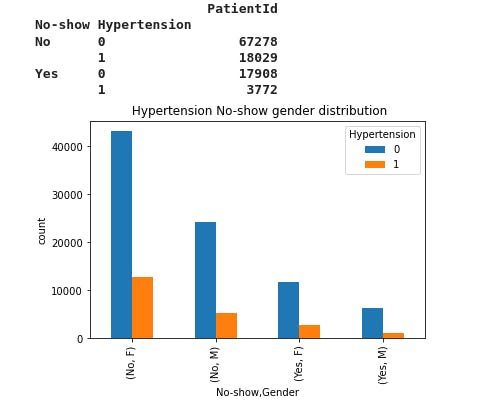
We notice that most almost 2500 female patient hypertension show up to the appointment and 1272 male patient with Hypertension did not show to the appointment Besides, 12k female patient without hypertension show up to the appointment and 6k male patient without hypertension show up to the appointment
33- SMS_received No-show gender distribution
distributionPlot('SMS_received',' SMS_received No-show gender distribution')
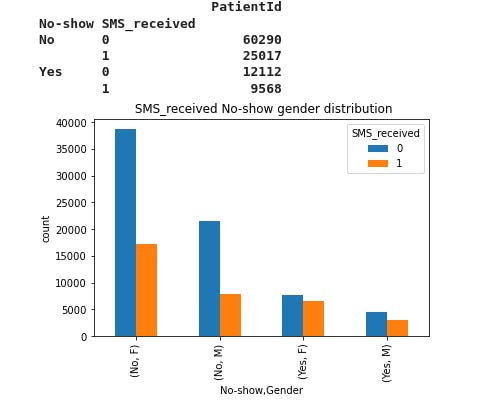
We notice that 8k patient female who did not receive a sms showed up to the appointment 7k patient females who received a sms show up to the appointment 4k patient male who did not receive a sms showed up to the appointment 3k patient male who received a sms showed up to the appointment 38k patient female who did not receive sms did not come to the appointment 17k patient female who received sms did not come to the appointment 22k patient male who did not receive sms did not come to the appointment 7k patient male who did not receive the sms did not come to the appointment
34- Age No-show gender distribution
boxplot = df.boxplot(column=['Age'] , by = ['No-show'] , notch = True, labels=['No-show','Age'])
pd.DataFrame(df.groupby(['No-show'])['Age'].describe().loc[:,['mean','std']])
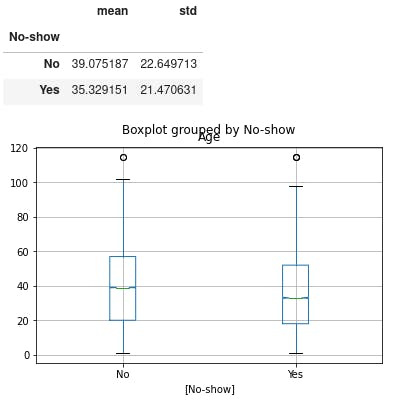
We notice that the average age of patient who did not show up are 39.07 and the average age of patients who showed up to the appointment are 35.32 We notice that 25% of the patient who did not show up to the appointment are aged around 20 and 25% of the patients who showed up to the appointment are 19 Further more 75% of the patients who did not showed up are 58 and 75% of the patients who showed up to the appointment are 47.
Conclusion
We notice that few patients respond to appointment given by the physicians in Brazil
The gender distribution revealed that
- 14275 female patients showed up to the appointment
- 7405 male patients showed up to the appointment
- 55843 female patients did not show up to the appointment
29464 male patients did not show up to the appointment.
The hypertension patient distribution revealed that
- 2500 female patient hypertension show up to the appointment
- 1272 male patient with Hypertension did not show to the appointment
- 12k female patient without hypertension show up to the appointment
6k male patient without hypertension show up to the appointment
The diabetes patient distribution revealed that
- 1200 female patients with diabetes showed up to the appointment
- 230 male patients with diabetes show up to the appointment.
- 15k female patients without diabetes showed up to the appointment
- 6k male patients without diabetes showed to the appointment.
- 52k female not having diabetes did not come to the appointment
- 4k female having diabetes did not come to the appointment.
The SMS_received patient distribution revealed that
- 7k patient females who received a sms show up to the appointment
- 4k patient male who did not receive a sms showed up to the appointment
- 3k patient male who received a sms showed up to the appointment
- 38k patient female who did not receive sms did not come to the appointment
- 17k patient female who received sms did not come to the appointment
- 22k patient male who did not receive sms did not come to the appointment
- 7k patient male who did not receive the sms did not come to the appointment
From the above research question, we conclude that
SMS_received influenced patient to show up to their appointment more that the other feature variables.
The above summary did not not reflect the actual data entry from the hospital cause it contained some discrepancies. 3,540 observations were dropped during the analysis to arrived at the above conclusion. Additional information would have been handy to explain the reason why we have zero and negative one in the independent variable Age.
Limitations
The dataset submit to our analysis in this project contains some data entry errors which affect the outcome of our analysis. Out of the 110,527 observations, we found a negative Age in observation row index 99832 of the observations. Moreover, we found out that there were 3539 observations having Age value to be 0. We assumed those discrepancies were some errors therefore we dropped 3,540 observations. Our analysis was carried out on 106,987 observations after cleaning the dataset which did not represent the actual population of the patients which might change the outcome of our result. We further need to know the distance of the patients to the nearest hospital where the appointment has been booked to figure out which few patients respond to their medical appointment. We need further to know why the hospital prefers text message over phone call since most of people don't read they sms often.
If you want to contribute or you find any errors in this article please do leave me a comment.
You can reach me out on any of the matrix decentralized servers. My element messenger ID is @maximilien:matrix.org
If you are in one of the mastodon decentralized servers, here is my ID @maximilien@qoto.org
If you are on linkedIn, you can reach me here
If you want to contact me via email for freelance maximilien@tutanota.de
Warm regards,
Maximilien.